Turning thousands of open-ended survey responses and NLP sentiment scores into a visual report clients can actually read — and present to their leadership.
Bizrate Insights collects millions of post-purchase survey responses annually — including open-ended comments that, when processed through NLP, reveal nuanced sentiment patterns structured questions miss. The challenge: how do you present that data to a VP of Marketing in a way that's immediately actionable?
I designed a visualization and reporting system that translates complex NLP output into a clean, hierarchical report that tells a clear story from executive summary down to granular detail.
NLP sentiment data is inherently complex — scores, distributions, topic tags, sample quotes, trend lines. The raw output was accurate but overwhelming. The goal was to design for the decision-maker, not the data scientist — someone who needs to walk into a quarterly review and explain to leadership what customers are saying and what to do about it.
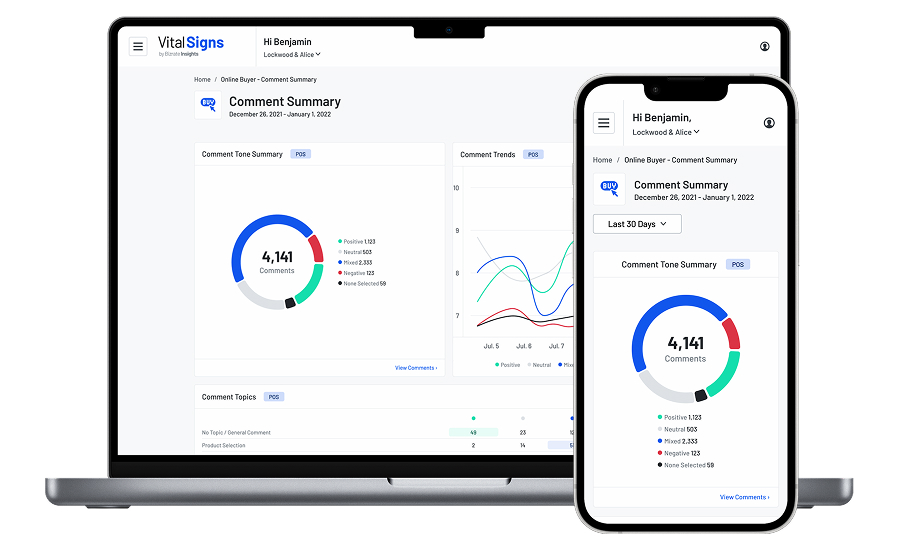
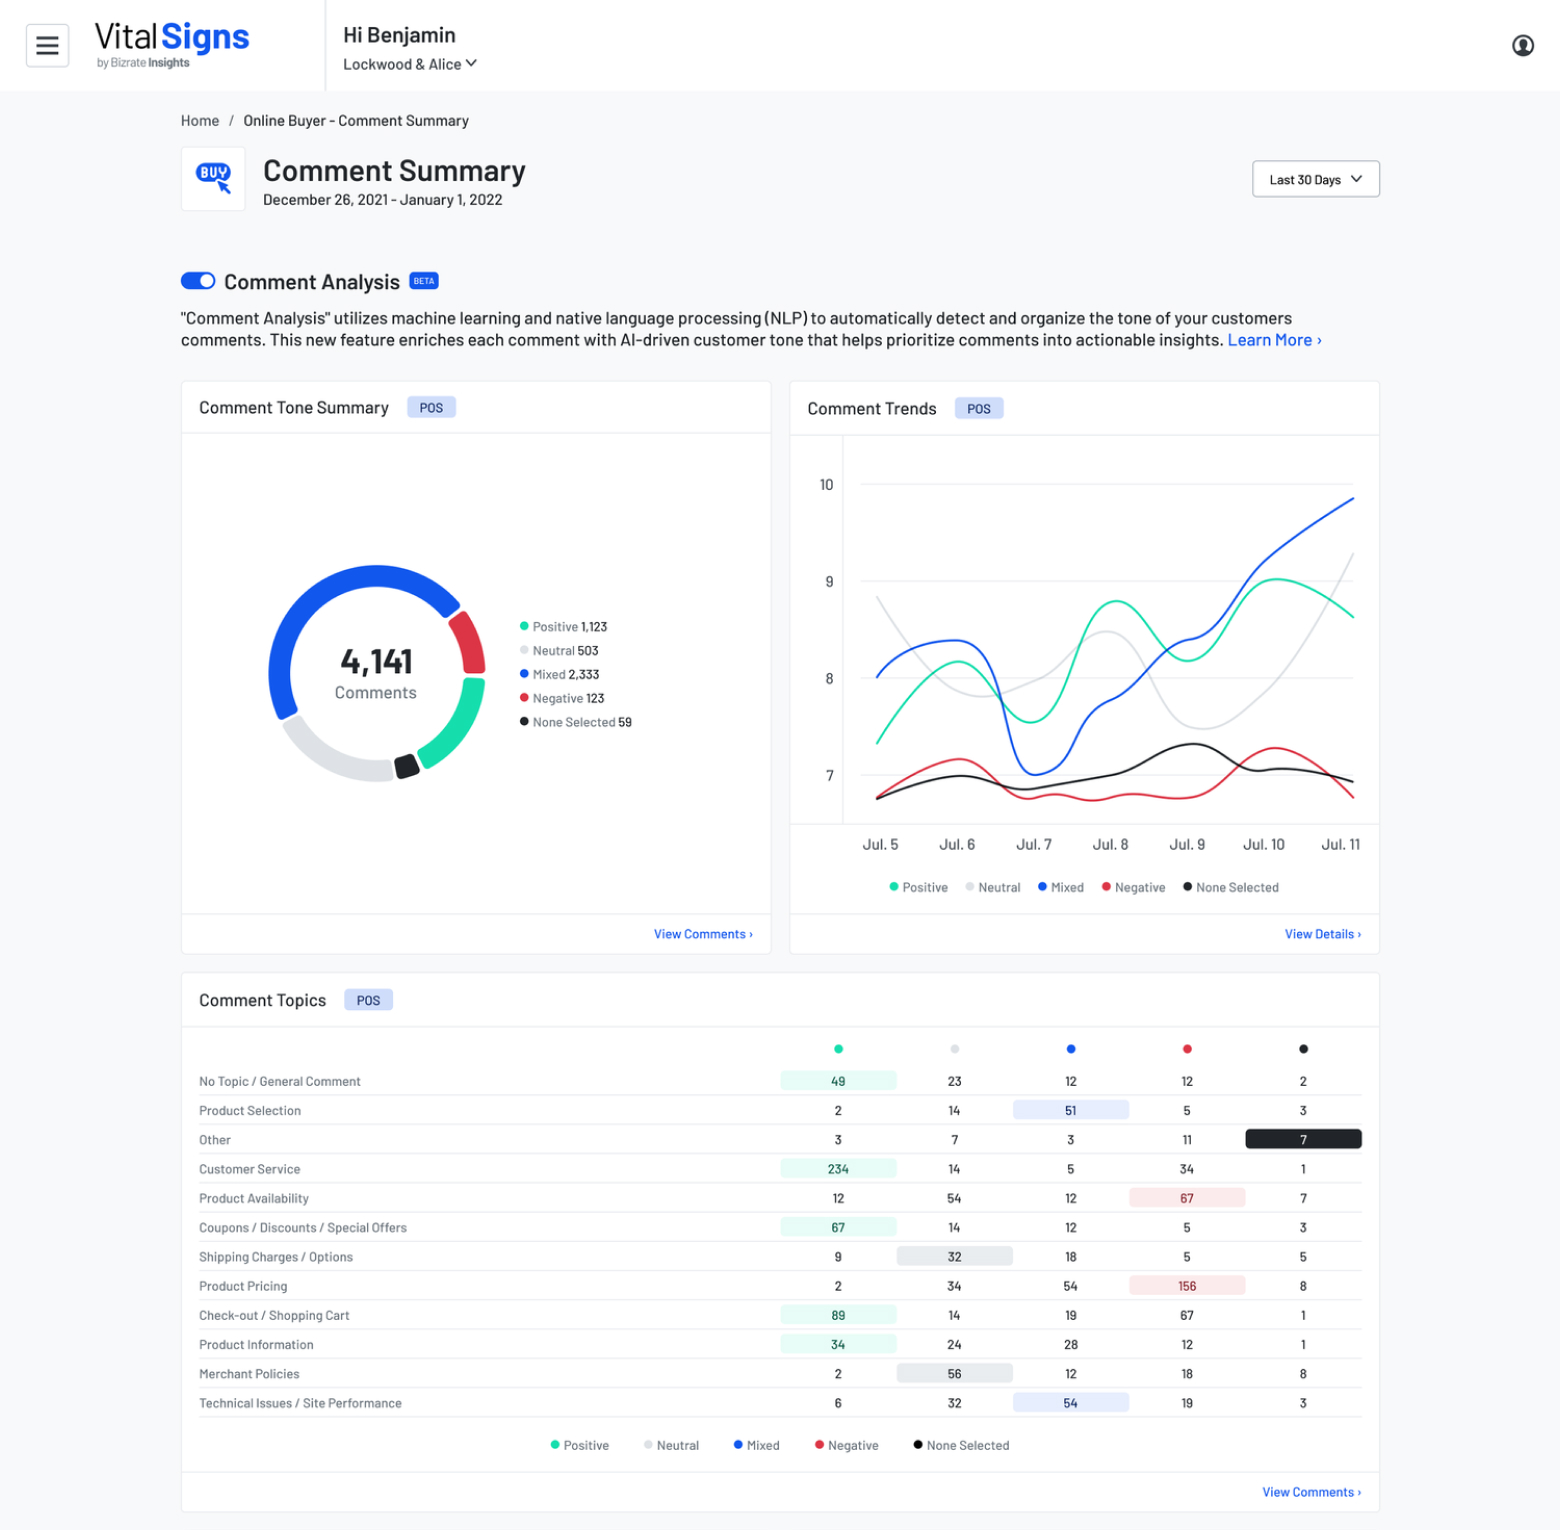
The VitalSigns Comment Analysis dashboard — sentiment distribution, trend lines, and topic breakdowns in one view.
The VitalSigns Comment Analysis dashboard — sentiment distribution, trend lines, and topic breakdowns in one view.